MNS, the Brooklyn real estate firm published their May 2013 Brooklyn Rental Market Report yesterday. The report reveals that the overall average increased by 61 basis points – from $2,486 in April to $2,503 in May – representing an increase of $16.60. Of the 14 neighborhoods analyzed in the report, the following six had negative growth from the previous month: Brooklyn Heights (-0.57%), Bushwick (-1.33%), Clinton Hill (-0.88%), Fort Greene (-0.91%), Greenpoint (-1.30%) and Prospect Lefferts Garden (-2.22%).
Some highlights of the report include the following:
- The overall rent average increased by 61 basis points – from $2,486 in April to $2,503 in May.
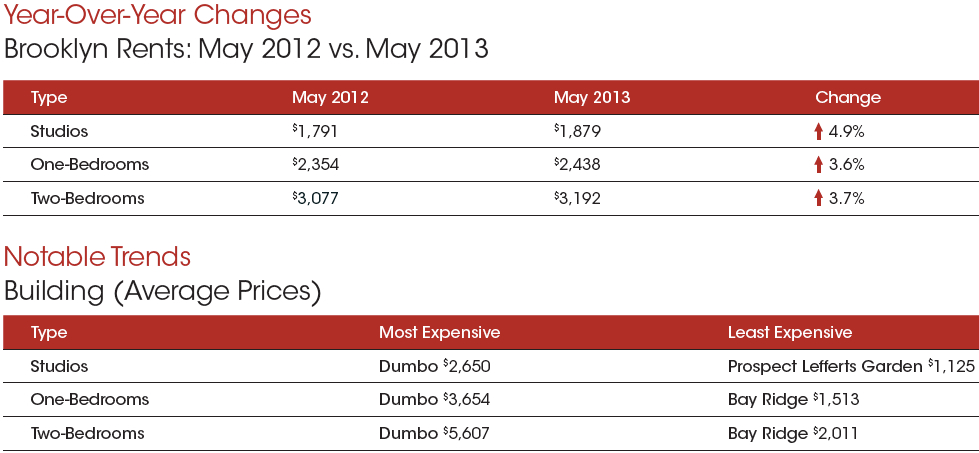
- The average rental price in Brooklyn during the previous 12 months has increased from $2,407 in May 2012 to $2,503 in May 2013 – representing a 3.99% gain.
- After reaching an all-time high of $2,687 during April, studios in Greenpoint have inevitably cooled of and dropped 10% to $2,416. Similarly, Bushwick studios have dropped -8.69% during May, after increasing a massive 20% during the previous 12 months.
- Continuing with the Bushwick / Greenpoint theme, both neighborhoods have experience tremendous growth in the last 12 months. Greenpoint studios (28%), 1 Bedroom (13%) ,2 Bedrooms (10%) and Bushwick studios (20%), 1 Bedroom (23%), 2 Bedroom (4%) apartments have all increased in rent.
According to the report, the most expensive average rents for one ($3,654) and two bedrooms ($5,607) were in Dumbo, and Williamsburg and Dumbo have the most expensive studio apartments ($2,652 and $2,650, respectively):
[+]
In Dumbo, studios were $2,650, one bedrooms $3,654, and two bedrooms $5,607. The May 2013 mean Brooklyn rental prices for studios ($1,879/mo), one bedroom ($2,438), and two bedrooms ($3,192).
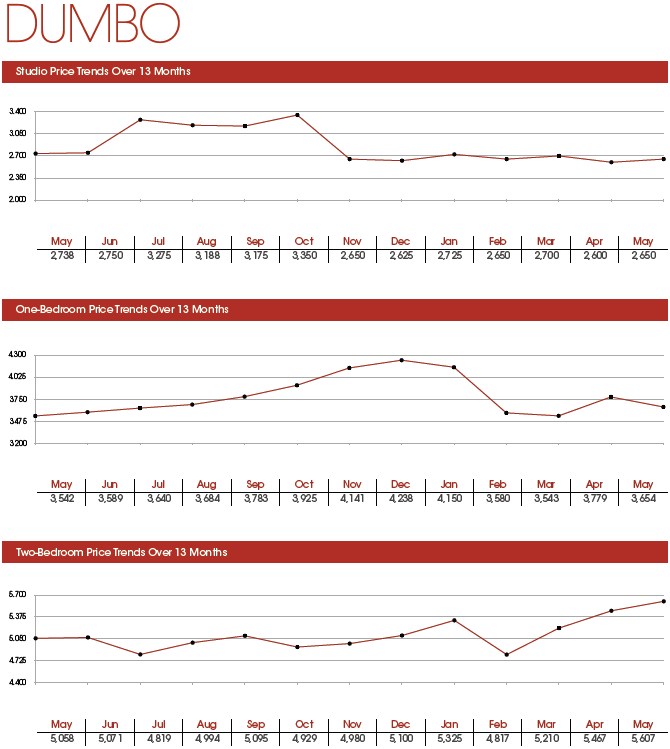
Here are the Dumbo price trends over 13 months for studios, one bedrooms, and two bedrooms:
[+]
The Brooklyn Rental Market ReportTM is based on a cross-section of data from available listings and priced under $10,000, with ultra-luxury property omitted to obtain a true monthly rental average. Our data is aggregated from the MNS proprietary database and sampled from a specific mid-month point to record current rental rates offered by landlords during that particular month. It is then combined with information from the REBNY Real Estate Listings Source (RLS), OnLine Residential (OLR.com) and R.O.L.E.X. (Real Plus).
The Brooklyn Rental Market Report ™ is published by MNS. The full Brooklyn Rental Market Report ™ by neighborhood (PDF(1.8MB)).


Pingback: Friday Blogwrap – insiderater.com
Pingback: Friday Blogwrap – insiderater.com